
ARTICLE
Design Firm Insurance: Data & Analytics

The Value of Greyling’s Approach to Comparative Benchmarking
Design firms crave comparative metrics – most firms want to know as much as possible about what their peers are doing. When leasing new space, your commercial real estate broker will give you pricing on “comps.” The same is true when buying a new home. And when your clients ask you to design a new structure, your firm’s professionals use data to determine how the project will fit into the budget.
Greyling takes the same approach with commercial insurance. We maintain a national database that allows us to use real data to reveal what the insurance marketplace can, and should, provide for a design firm’s insurance program. We’ve developed this approach into a series of steps, a consistent process that delivers market-leading results.
New clients of Greyling average over 15% in savings versus prior premiums, and many also end up with higher limits, right-sized retentions, and coverage enhancements or correction of gaps. These results are possible through Greyling’s relevant and accurate benchmarking process – described further in this Risk Report.
After any initial savings, our comparative benchmarking keeps insurers honest and consistent year-after-year to the benefit of our clients. With this innovative approach, we have saved clients millions of dollars in insurance premiums. Download a case study that demonstrates just how compelling Greyling’s process can be.
An analysis based on data and metrics, of course, requires initial information for comparison purposes. This includes a copy of current policies, renewal applications for key coverages such as professional liability, and a rough idea of loss history for each line of coverage – good, fair, poor, etc. A checklist is provided. We keep this information confidential and use only our own proprietary data; we are always happy to sign a Non-Disclosure Agreement with firms regarding this information.
Once the baseline information is collected, Greyling assigns a team of specialists to analyze information, including coverage, policy limits, deductibles, or self-insured retentions (SIR) and risk funding. The program analysis includes a full review of a firm’s exposures and analysis of policies to see if they match up. Because most insurance policies are “off-the-shelf one-size-fits-all” disconnects are common. Here are a few examples:
- Insured works for public entities and policy excludes all government work
- Hydrographic survey equipment is used underwater but only covered when not in the water
- Ancillary professional consulting services are uninsured
- Projects in the Middle East require local admitted coverage but it is not provided
- Certain employees are eligible for federal workers' compensation benefits, but exposure is not covered
- Fraudulent transfer of funds via cyber theft is not covered
- Property in a flood zone is not insured for flood
While no two large design firms are the same, Greyling has data on the insurance programs for enough firms to develop meaningful comparisons. One benefit of our singular national approach is we see firms all over the country. We can compare all aspects of an insurance program from similar firms and provide metrics for low, median, average, and high comparables for cost, limits, and deductibles/SIRs.

To help insureds better understand their insurance programs, and especially how all policies work together, we develop an illustration of every policy and how they interact. We’ve had some CEOs say that’s the first time they understood what they’ve purchased. Having a clear illustration makes it easier to make informed decisions on changes needed, if any, for the proper level of protection.
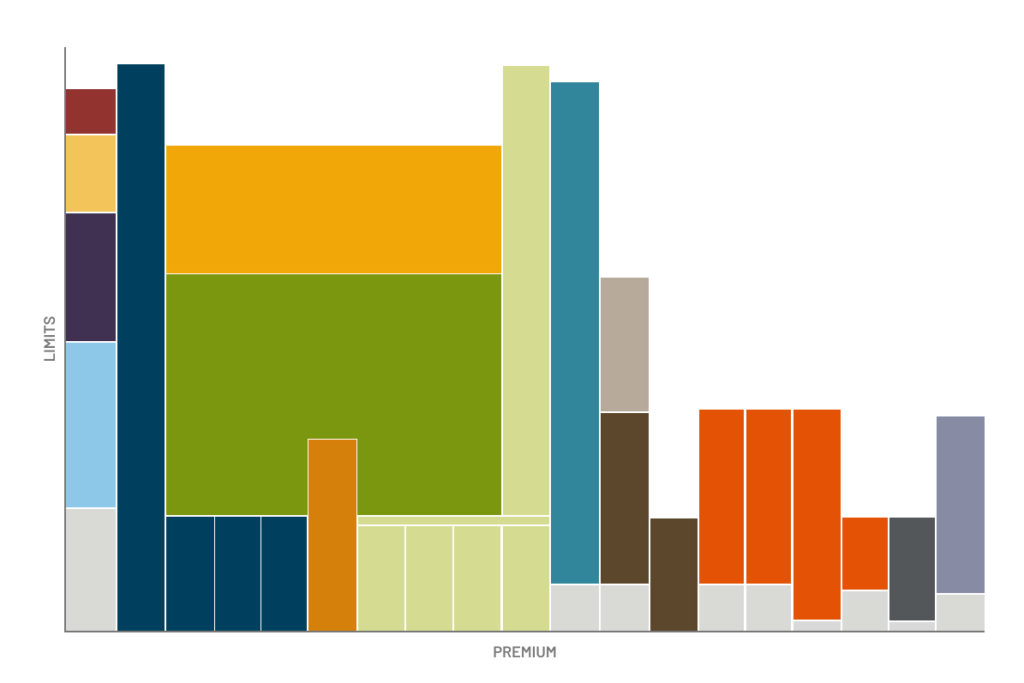
We then gather the decision-makers to present:
- Coverage: Gaps and fixes (based on what is available) are illustrated on the big chart
- Policy Limits, Deductible/Self-Insured Retention (SIR) and Pricing: Bar charts are provided showing comparative data including average, low and high ranges
If we end up working together, Greyling is responsible for delivering on the coverage fixes promised and what the benchmark data said about limits, deductibles/SIRs and premiums. On the first renewal, we provide a comparison between what was promised and what was delivered. While results vary from firm to firm, you can download a case study with actual results.
Our process leads many firms to decide they need a new broker because the findings are often compelling. Sometimes it is major coverage gaps, sometimes it’s pricing, and sometimes both. Business is too competitive for firms to be unexpectedly uninsured or to overpay, compared to your competitors, for insurance.
AUTHOR

KENT W. COLLIER, JD
MANAGING PRINCIPAL
Kent provides day-to-day service to Greyling clients regarding insurance and risk issues in the architecture, engineering, construction, environmental, and legal service fields. He brokers practice and project specific insurance placements for A/E, construction, and law firms across the country. Drawing on years of experience as a construction attorney, Kent is heavily involved in his clients’ recognition, reporting, and resolution of insured claims.
Kent performs risk management consulting for clients including preparation and presentation of educational seminars, compilation and analysis of risk surveys, drafting and negotiating professional services contracts, and answering various client questions concerning legal, insurance, and risk issues impacting the construction and engineering industry. He has experience presenting continuing education training to staff regarding risk management, contracts, and insurance topics.